Multiple layers
If you add multiple layers of the same type to a map, you need to supply a unique layer_id for each layer. If you don’t, Deck.gl will get conflicted and will assume the last layer you plotted contains the most recent data you want to plot.
In this example, the first add_path() is setting roads of type “STREET” to green (#00FF00FF), and the second layer is setting those of type “ROAD” to white. However, notice only the white layer is plotted.
mapdeck( style = mapdeck_style("dark") ) %>%
  add_path(
    data = roads[ roads$ROAD_TYPE %in% "STREET",]
    , stroke_colour = "#00FF00FF" ) %>%
  add_path(
    data = roads[ roads$ROAD_TYPE %in% "ROAD",]
    , stroke_colour = "#FFFFFFFF" )
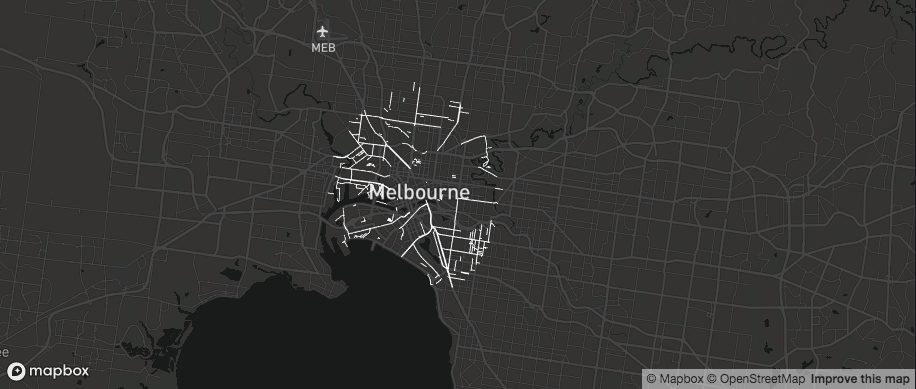
white roads
Setting a layer_id (on one or both layers) solves this
mapdeck( style = mapdeck_style("dark") ) %>%
  add_path(
    data = roads[ roads$ROAD_TYPE %in% "STREET",]
    , stroke_colour = "#00FF00FF"
    , layer_id = "green" ) %>%
  add_path(
    data = roads[ roads$ROAD_TYPE %in% "ROAD",]
    , stroke_colour = "#FFFFFFFF"
    )
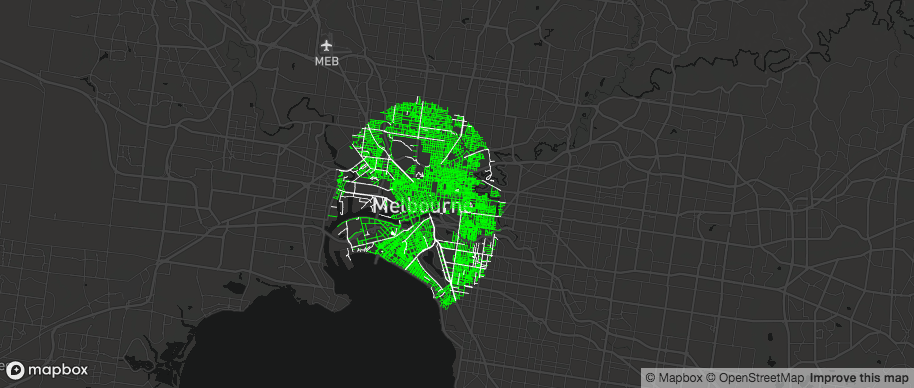
white and green roads
Shiny
Updating the map
If you are dynamically adding and removing layers in a shiny app you should use
-
mapdeck()to define the map, then -
mapdeck_update()inside anobserveEvent()(or similar) function to add & remove layers to the initial map.
If you only use mapdeck() inside a reactive / observe function the map gets re-draw every call. The mapdeck_update() will only udpate the data on the map, and not re-draw the map.
library(shiny)
library(shinydashboard)
library(mapdeck)

ui <- dashboardPage(
    dashboardHeader()
    , dashboardSidebar(
        actionButton(inputId = "roads", label = "roads")
    )
    , dashboardBody(
        mapdeckOutput(outputId = "map")
    )
)

server <- function(input, output) {

    ## initialise a map
    output$map <- renderMapdeck({
        mapdeck()
    })

    ## use an observer to add and remove layers
    observeEvent({input$roads},{

        if ( input$roads %% 2 == 1 ) {

            mapdeck_update(map_id = "map") %>%
                add_path(
                    data = roads
                    , layer_id = "myRoads"
                    , stroke_colour = "RIGHT_LOC"
                    , update_view = TRUE
                    )
        } else {
          mapdeck_update(map_id = "map") %>%
                clear_path(layer_id = "myRoads")
        }
    })
}

shinyApp(ui, server)
You will have noticed I’m using update_view = TRUE (the default) inside the layer methods. This will cause the map to re-focus on the layer being added.
update_view
Setting update_view = TRUE has a cumulative effect. Every layer which has update_view = TRUE will expand the map view to accomodate each layer. If you want to focus on a specific layer you can use focus_layer = TRUE
If you don’t want the map to change focus when adding a new layer set update_view = FALSE. However, if you start with a map without any data you may want to use the location argument to set the default position of the map.
library(shiny)
library(shinydashboard)
library(mapdeck)

ui <- dashboardPage(
    dashboardHeader()
    , dashboardSidebar(
        actionButton(inputId = "roads", label = "roads")
    )
    , dashboardBody(
        mapdeckOutput(outputId = "map")
    )
)

server <- function(input, output) {

    ## initialise a map
    output$map <- renderMapdeck({
        mapdeck( location = c(144.9, -37), zoom = 5 )
    })

    ## use an observer to add and remove layers
    observeEvent({input$roads},{

        if ( input$roads %% 2 == 1 ) {

            mapdeck_update(map_id = "map") %>%
                add_path(
                    data = roads
                    , layer_id = "myRoads"
                    , stroke_colour = "RIGHT_LOC"
                    , update_view = FALSE
                    )
        } else {
          mapdeck_update(map_id = "map") %>%
                clear_path(layer_id = "myRoads")
        }
    })
}

shinyApp(ui, server)
focus_layer
In this example, even though the scatterplot data uses update_view = TRUE, the next layer has focus_layer = TRUE, so the map bounds will focus on this layer.
mapdeck() %>%
 add_scatterplot(
   data = capitals
   , lon = "lon", lat = "lat"
   , fill_colour = "country"
   , radius = 100000
   , update_view = TRUE
   ) %>%
 add_path( roads, focus_layer = TRUE )
Returning data
Most layers let you specify an id value
an id value in data to identify layers when interacting in Shiny apps
If this value refers to a column of your data, this value is returned to your shiny session when you click on the layer in a shiny app. This way you know which row of data refers to the object you clicked on.
You can observe click events using the syntax input$<map_id><layer>click
So to observe clicks on the path layer on a map you’ve called ‘map’, you would use
observeEvent({input$map_path_click})
To see this in action, here’s an example shiny for you
library(shiny)
library(shinydashboard)
library(mapdeck)

ui <- dashboardPage(
    dashboardHeader()
    , dashboardSidebar(
        actionButton(inputId = "roads", label = "roads")
    )
    , dashboardBody(
        mapdeckOutput(outputId = "map")
    )
)

server <- function(input, output) {

    ## initialise a map
    output$map <- renderMapdeck({
        mapdeck() %>%
                add_path(
                    data = roads[1:3, ]
                    , stroke_width = 5
                    , id = "FQID"
                    )
    })

    ## use an observer to respond to the click event.
    observeEvent({input$map_path_click},{
        print( input$map_path_click )

        js <- input$map_path_click
        lst <- jsonlite::fromJSON( js )
        print( lst )
    })
}

shinyApp(ui, server)
This doesn’t work for geojson, or layers where the data is aggregated
- add_geojson()
- add_screengrid()
- add_grid()
- add_hexagon()
Instead, you get all the aggregated data points
sf
If you have issues plotting a subset of rows of an sf object, it may be because you haven’t loaded library(sf).
To see what I mean, restart your R session, then run these commands.
You should see the map fully zoomed out. This is because it can’t find the bounding box of the subset object.
attr( roads[1:5, ][["geometry"]], "bbox")
# NULL
Whereas if you load the sf library, you use its subsetting method, which gives you the bounding box