Basic
In simple terms, if you want to add a legend to your map, set legend = TRUE. This will add a legend for either fill_colour or stroke_colour values (depending on which one the layer supports)
mapdeck() %>%
    add_scatterplot(
        data = capitals
        , lat = "lat", lon = "lon"
        , radius = 500000
        , fill_colour = "country"
        , legend = TRUE
    )
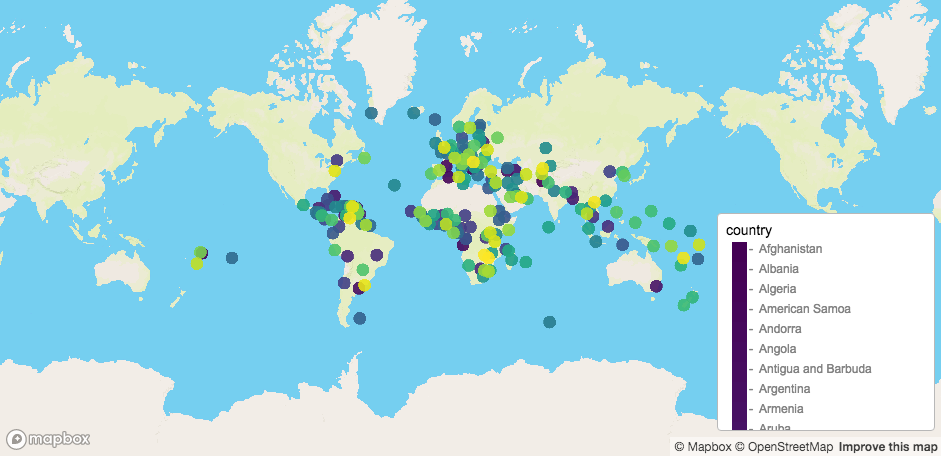
legend
In more-complex-but-still-simple terms, if the layer supports multiple fill and/or strokes, and you only want to show one of them in the legend, you can use a list to specify which coloured variables are included, such as
url <- 'https://raw.githubusercontent.com/plotly/datasets/master/2011_february_aa_flight_paths.csv'
flights <- read.csv(url)
flights$id <- seq_len(nrow(flights))
flights$stroke <- sample(1:3, size = nrow(flights), replace = T)
flights$info <- paste0("<b>",flights$airport1, " - ", flights$airport2, "</b>")
flights$airline <- as.character( flights$airline )
flights$airport1 <- as.character( flights$airport1 )
flights$airport2 <- as.character( flights$airport2 )

mapdeck() %>%
    add_arc(
        data = flights
        , layer_id = "arc_layer"
        , origin = c("start_lon", "start_lat")
        , destination = c("end_lon", "end_lat")
        , stroke_from = "airport1"
        , stroke_to = "airport2"
        , stroke_width = "stroke"
        , tooltip = "info"
        , auto_highlight = TRUE
        , legend = list( stroke_from = TRUE, stroke_to = FALSE )
    )
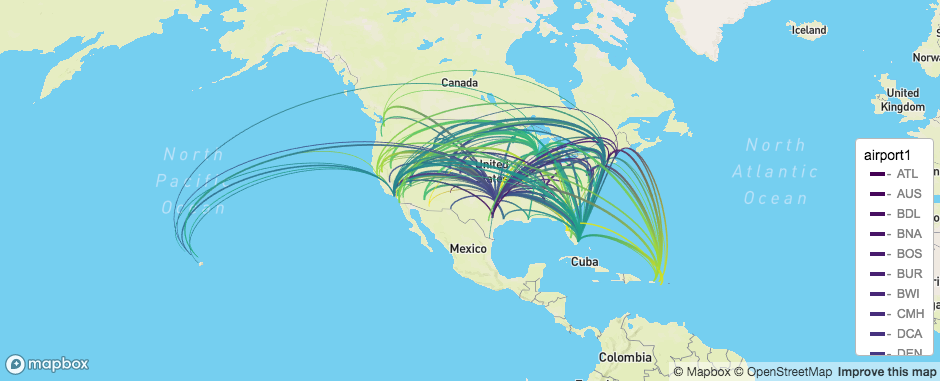
legend
Formatting
There are two ways to format the legends
-
legend_optionsfor controlling the appearance of the legend -
legend_formatfor formatting the values in the legend
Legend Options
In the legend_options argument you use a list to control the title, css and digits (number of decimal places) of the legend
mapdeck() %>%
    add_arc(
        data = flights
        , layer_id = "arc_layer"
        , origin = c("start_lon", "start_lat")
        , destination = c("end_lon", "end_lat")
        , stroke_from = "airport1"
        , stroke_to = "end_lon"
        , stroke_width = "stroke"
        , tooltip = "info"
        , auto_highlight = TRUE
        , legend = TRUE
        , legend_options = list(
            stroke_from = list( title = "Origin airport"),
            stroke_to = list(title = "Destination (longitude)",  digits = 3)
            , css = "max-height: 100px;" ## css applied to both stroke_from and stroke_to
        )
    )
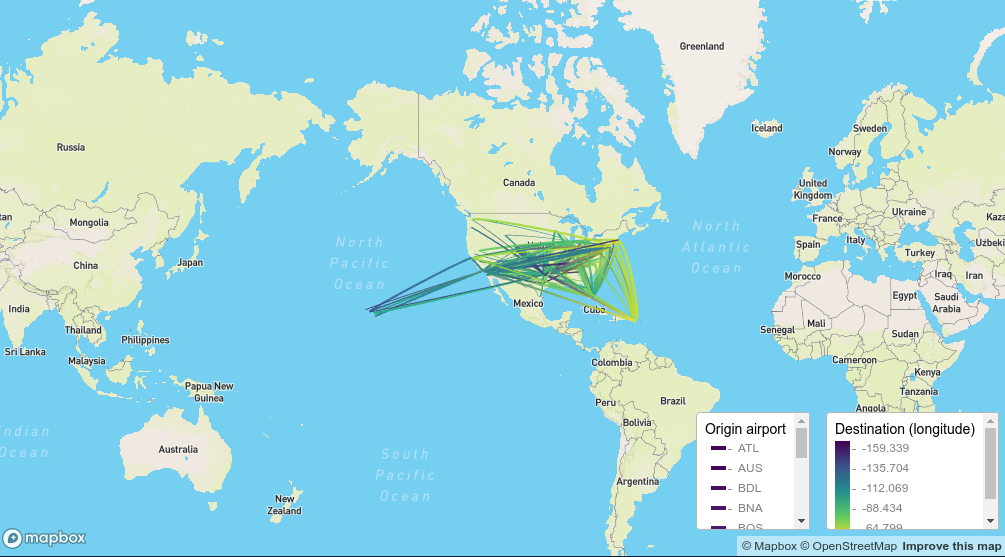
legend options
Legend Format
This argument lets you control the appearance of the values in the legend. Simply pass in a function to apply to the values.
mapdeck() %>%
    add_polygon(
        data = melbourne
        , polyline = "polyline"
        , fill_colour = "AREASQKM"
        , legend = TRUE
        , legend_format = list( fill_colour = as.integer )
    )
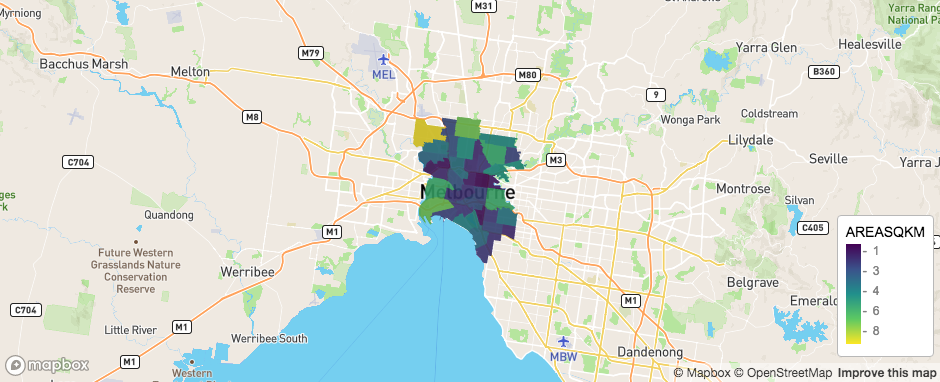
legend format
Formatting Dates
POSIX objects are a bit tricker. At the heart of mapdeck, all code is written in C++, and any time-zone attributes are lost from the R POSIXct object, and the underlying numeric data is converted to UTC.
df <- capitals
df$date <- seq(
    as.POSIXct("2018-01-01 00:00:00", tz = "Australia/Melbourne"),
    as.POSIXct("2019-01-01 00:00:00", tz = "Australia/Melbourne"),
    length.out = nrow(df)
    )

mapdeck() %>%
    add_scatterplot(
        data = df
        , lon = "lon", lat = "lat"
        , fill_colour = "date"
        , radius = 500000
        , legend = TRUE
    )
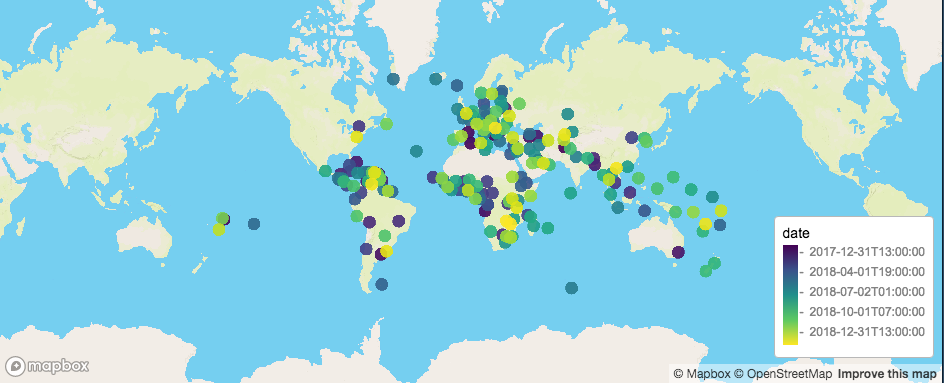
legend dates
Notice the dates have been converted to UTC, and includes the T time-zone identifier.
Therefore, if you want to convert the legend back to Australia/Melbourne, you need to use a function for this.
format_dates <- function( x ) {
        x <- as.POSIXct(x, tz = "UTC", format = "%Y-%m-%dT%H:%M:%S")
        attr( x, "tzone" ) <- "Australia/Melbourne"
        x <- as.character( x )
        x
}


mapdeck() %>%
    add_scatterplot(
        data = df
        , lon = "lon", lat = "lat"
        , fill_colour = "date"
        , radius = 500000
        , legend = TRUE
        , legend_format = list( fill_colour = format_dates )
    )
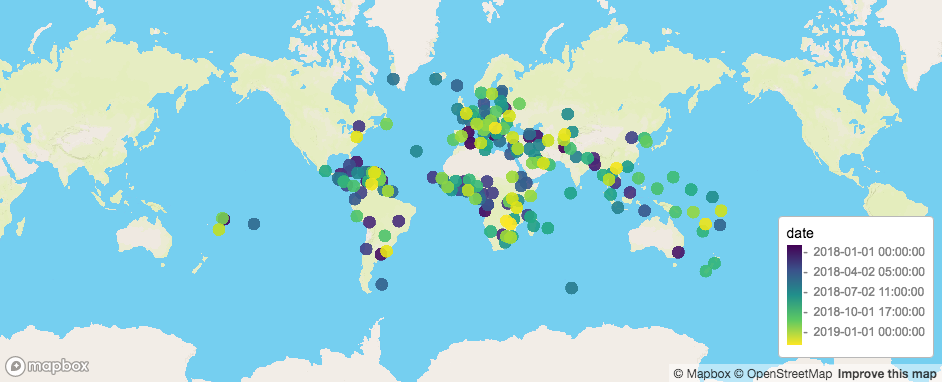
legend dates
Note, also, the final as.character() call in the formatting function. This is because the legend is converted to JSON using jsonify::to_json(), which uses the same C++ code as mapdeck (in fact, it IS the c++ code mapdeck uses). So if the legend contains a POSIXct object after formatting, it will again be converted to UTC.
Manual Legends
If you want to create your own legend you can do so using mapdeck_legend(), which accepts legend_elements as its argument, creates the required JSON, which you can then use in the legend argument of any of the layers
sf <- spatialwidget::widget_melbourne
sf$my_colour <- ifelse( substr(sf$SA2_NAME, 1, 1) == "A", "#00FF00FF", "#FF0000FF")

l1 <- legend_element(
    variables = c("Begins with A", "Doesn't begin with A")
    , colours = c("#00FF00FF", "#FF0000FF")
    , colour_type = "fill"
    , variable_type = "category"
)
js <- mapdeck_legend(l1)

mapdeck() %>%
    add_polygon(
        data = sf
        , fill_colour = "my_colour"
        , legend = js
    )
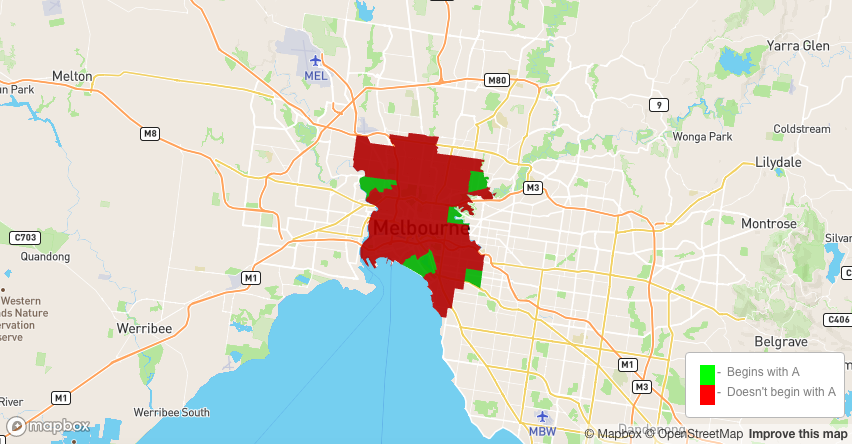
manual legend