![]()

What does it do?
It maps viridis colours (by default) to values, and quickly!
Note It does not perform a 1-to-1 mapping of a palette to values. It interpolates the colours from a given palette.
Why did you build it?
I’m aware there are other methods for mapping colours to values. And which do it quick too. But I can never remember them, and I find the interfaces a bit cumbersome. For example, scales::col_numeric(palette = viridisLite::viridis(5), domain = range(1:5))(1:5).
I wanted one function which will work on one argument.
colour_values(1:5)
# [1] "#440154FF" "#3B528BFF" "#21908CFF" "#5DC963FF" "#FDE725FF"
colour_values(letters[1:5])
# [1] "#440154FF" "#3B528BFF" "#21908CFF" "#5DC963FF" "#FDE725FF"
I also want it available at the src (C/C++) level for linking to other packages.
Why do you spell colour with a ‘u’?
Because it’s correct, and R tells us to
For consistency, aim to use British (rather than American) spelling
But don’t worry, color_values(1:5) works as well
How can I make use of it in my package?
Rcpp
All functions are written in Rcpp. I have exposed some of them in header files so you can “link to” them in your package.
For example, the LinkingTo section in DESCRIPTION will look something like
And in a c++ source file so you can #include a header and use the available functions
R
If you’re not using Rcpp, just Import this package like you would any other.
Do you have any examples?
Of course!
256 numbers mapped to a colour
bar_plot <- function(df) {
  barplot( height = df[["a"]], col = df[["col"]], border = NA, space = 0, yaxt = 'n')
}
df <- data.frame(a = 10, x = 1:256)
df$col <- colour_values(df$x, palette = "viridis")
bar_plot( df )


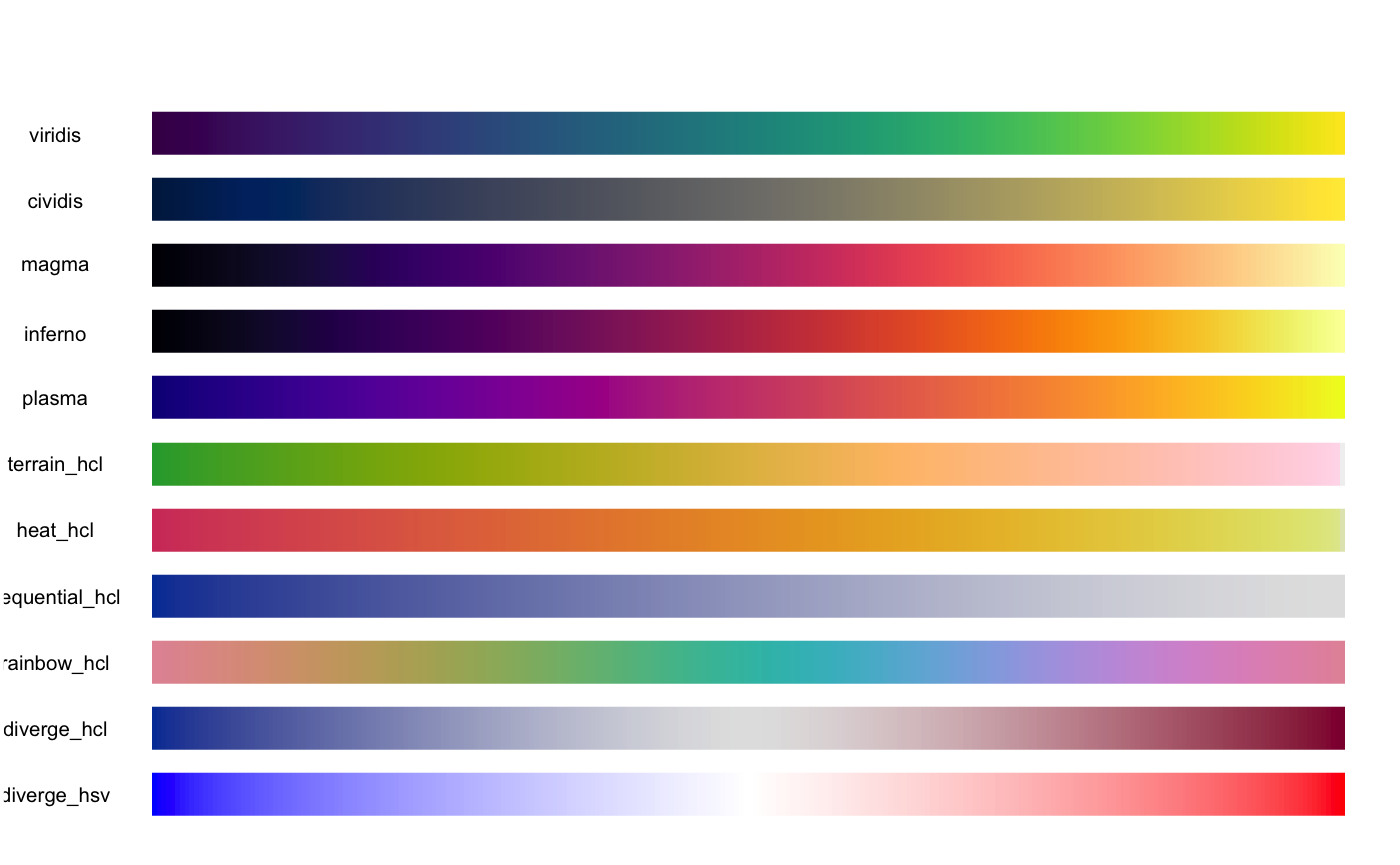
Are there only viridis palettes?
No, you can chose one from
colour_palettes()
#  [1] "viridis"        "cividis"        "magma"          "inferno"
#  [5] "plasma"         "ylorrd"         "ylorbr"         "ylgnbu"
#  [9] "ylgn"           "reds"           "rdpu"           "purples"
# [13] "purd"           "pubugn"         "pubu"           "orrd"
# [17] "oranges"        "greys"          "greens"         "gnbu"
# [21] "bupu"           "bugn"           "blues"          "spectral"
# [25] "rdylgn"         "rdylbu"         "rdgy"           "rdbu"
# [29] "puor"           "prgn"           "piyg"           "brbg"
# [33] "terrain"        "topo"           "heat"           "cm"
# [37] "rainbow"        "terrain_hcl"    "heat_hcl"       "sequential_hcl"
# [41] "rainbow_hcl"    "diverge_hcl"    "diverge_hsv"    "ygobb"
# [45] "matlab_like2"   "matlab_like"    "magenta2green"  "cyan2yellow"
# [49] "blue2yellow"    "green2red"      "blue2green"     "blue2red"
And you can use show_colours() to view them all. Here’s what some of them look like
Do I have to use the in-built palettes?
No, you can use your own specified as a matrix of red, green and blue columns in the range [0,255]
n <- 100
m <- grDevices::colorRamp(c("red", "green"))( (1:n)/n )
df <- data.frame(a = 10, x = 1:n)
df$col <- colour_values(df$x, palette = m)
bar_plot( df )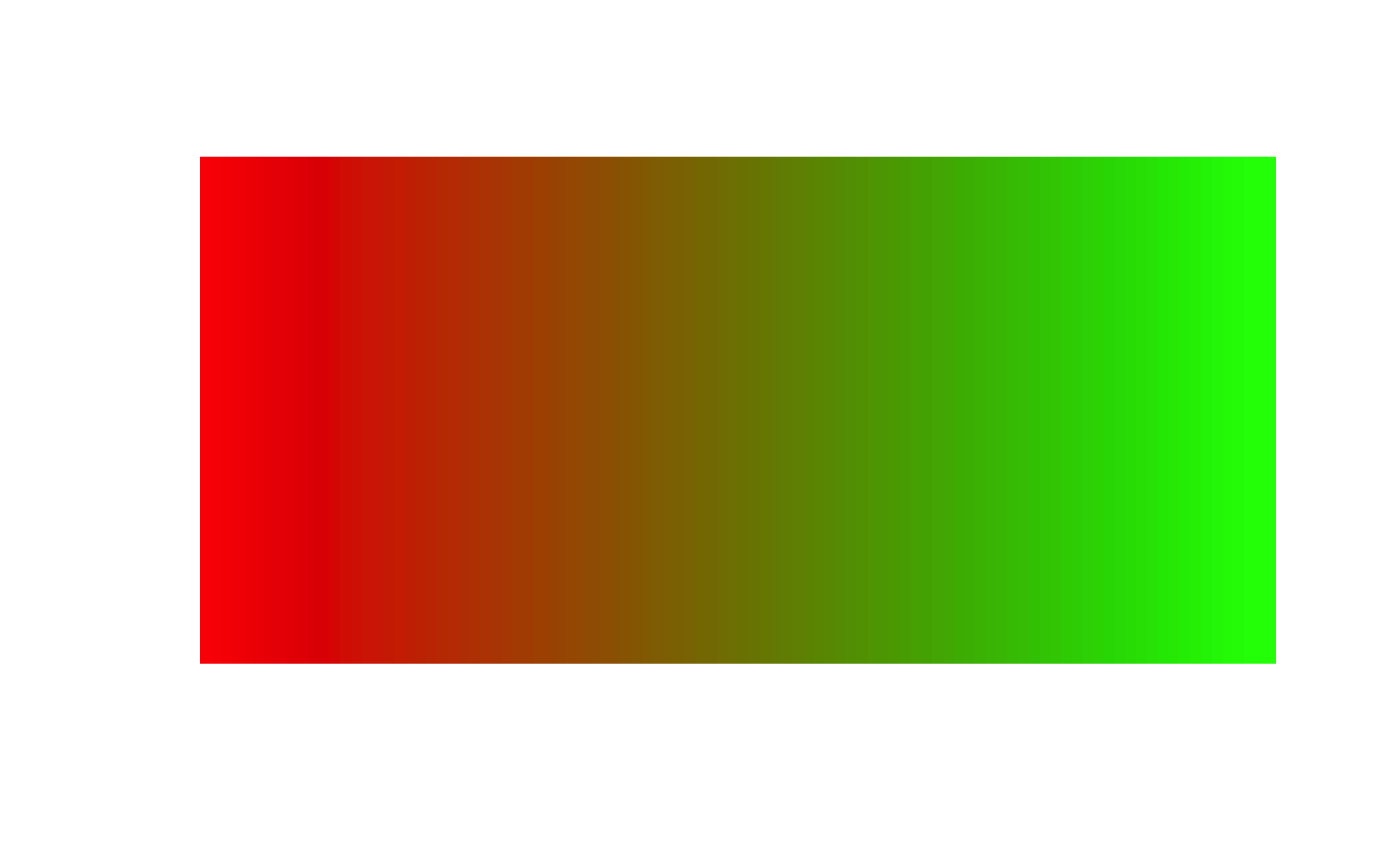
Do you support ‘alpha’ values
Yep. Either supply a single alpha value for all the colours
## single alpha value for all colours
df <- data.frame(a = 10, x = 1:255)
df$col <- colour_values(df$x, alpha = 50)
bar_plot( df )
Or use a vector of values the same length as x
df <- data.frame(a = 10, x = 1:300, y = rep(c(1:50, 50:1), 3) )
df$col <- colour_values(df$x, alpha = df$y)
bar_plot( df )
Or include the alpha value as a 4th column in the palette matrix
n <- 100
m <- grDevices::colorRamp(c("red", "green"))( (1:n)/n )
## alpha values
m <- cbind(m, seq(0, 255, length.out = 100))
df <- data.frame(a = 10, x = 1:n)
df$col <- colour_values(df$x, palette = m)
bar_plot( df )
Can I get a summary of colours to use in a legend?
Yes, for numeric values use the n_summaries argument to specify the number of summary values you’d like
colour_values(1:10, n_summaries = 3)
# $colours
#  [1] "#440154FF" "#482878FF" "#3E4A89FF" "#31688EFF" "#26838EFF"
#  [6] "#1F9D89FF" "#35B779FF" "#6CCE59FF" "#B4DD2CFF" "#FDE725FF"
#
# $summary_values
# [1] "1.00"  "5.50"  "10.00"
#
# $summary_colours
# [1] "#440154FF" "#21908CFF" "#FDE725FF"
You can also specify the number of digits you’d like returned in the summary
colour_values(rnorm(n = 10), n_summaries = 3, digits = 2)
# $colours
#  [1] "#39568CFF" "#1F968BFF" "#440154FF" "#FDE725FF" "#277F8EFF"
#  [6] "#355F8DFF" "#482575FF" "#2C738EFF" "#453781FF" "#48196BFF"
#
# $summary_values
# [1] "-1.64" "0.29"  "2.22"
#
# $summary_colours
# [1] "#440154FF" "#21908CFF" "#FDE725FF"
You can also use format = FALSE if you don’t want the summary values formatted.
dte <- seq(as.Date("2018-01-01"), as.Date("2018-02-01"), by = 1)
colour_values(dte, n_summaries = 3)
# $colours
# [1] "#440154FF" "#470D60FF" "#48196BFF" "#482474FF" "#472E7CFF"
# [6] "#453882FF" "#414286FF" "#3E4B8AFF" "#3A548CFF" "#365D8DFF"
# [11] "#32658EFF" "#2E6D8EFF" "#2B758EFF" "#287D8EFF" "#25858EFF"
# [16] "#228C8DFF" "#20948CFF" "#1E9C89FF" "#20A386FF" "#25AB82FF"
# [21] "#2DB27DFF" "#39BA76FF" "#48C16EFF" "#58C765FF" "#6ACD5BFF"
# [26] "#7ED34FFF" "#92D742FF" "#A8DB34FF" "#BEDF26FF" "#D4E21BFF"
# [31] "#E9E41AFF" "#FDE725FF"
#
# $summary_values
# [1] "2018-01-01" "2018-01-16" "2018-02-01"
#
# $summary_colours
# [1] "#440154FF" "#21908CFF" "#FDE725FF"
colour_values(dte, n_summaries = 3, format = F)
# $colours
# [1] "#440154FF" "#470D60FF" "#48196BFF" "#482474FF" "#472E7CFF"
# [6] "#453882FF" "#414286FF" "#3E4B8AFF" "#3A548CFF" "#365D8DFF"
# [11] "#32658EFF" "#2E6D8EFF" "#2B758EFF" "#287D8EFF" "#25858EFF"
# [16] "#228C8DFF" "#20948CFF" "#1E9C89FF" "#20A386FF" "#25AB82FF"
# [21] "#2DB27DFF" "#39BA76FF" "#48C16EFF" "#58C765FF" "#6ACD5BFF"
# [26] "#7ED34FFF" "#92D742FF" "#A8DB34FF" "#BEDF26FF" "#D4E21BFF"
# [31] "#E9E41AFF" "#FDE725FF"
#
# $summary_values
# [1] 17532.0 17547.5 17563.0
#
# $summary_colours
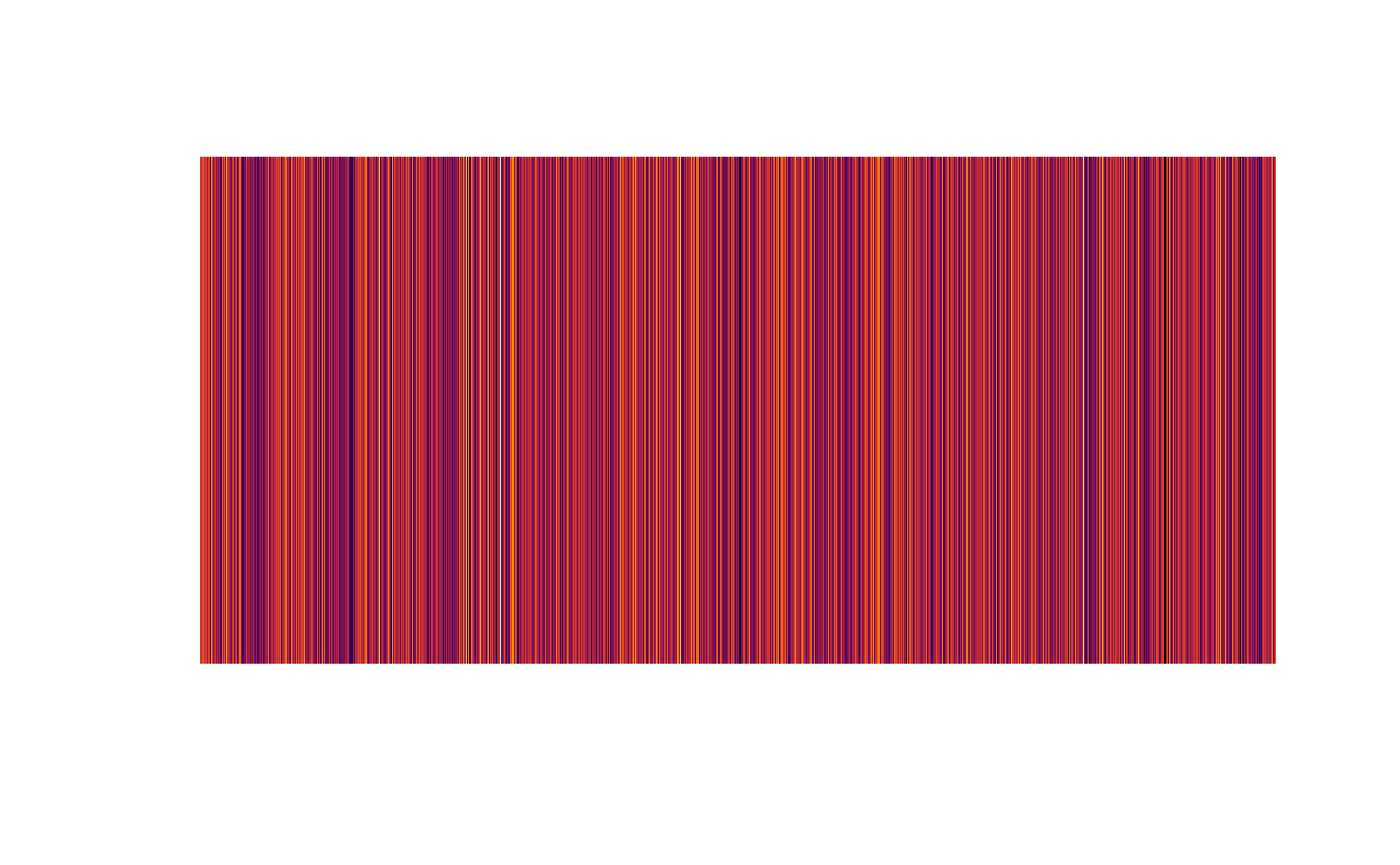
# [1] "#440154FF" "#21908CFF" "#FDE725FF"For categorical values use summary = TRUE to return a uniqe set of the values, and their associated colours
colour_values(sample(letters, size = 50, replace = T), summary = T)
# $colours
#  [1] "#55C667FF" "#453781FF" "#FDE725FF" "#404788FF" "#287D8EFF"
#  [6] "#FDE725FF" "#29AF7FFF" "#1F968BFF" "#238A8DFF" "#B8DE29FF"
# [11] "#2D708EFF" "#29AF7FFF" "#2D708EFF" "#FDE725FF" "#95D840FF"
# [16] "#FDE725FF" "#481567FF" "#39568CFF" "#287D8EFF" "#3CBB75FF"
# [21] "#2D708EFF" "#DCE319FF" "#FDE725FF" "#3CBB75FF" "#20A387FF"
# [26] "#481567FF" "#29AF7FFF" "#481567FF" "#440154FF" "#238A8DFF"
# [31] "#440154FF" "#73D055FF" "#73D055FF" "#440154FF" "#482677FF"
# [36] "#DCE319FF" "#482677FF" "#440154FF" "#95D840FF" "#238A8DFF"
# [41] "#DCE319FF" "#DCE319FF" "#55C667FF" "#482677FF" "#33638DFF"
# [46] "#440154FF" "#33638DFF" "#482677FF" "#73D055FF" "#440154FF"
#
# $summary_values
#  [1] "a" "b" "c" "e" "f" "g" "h" "j" "k" "m" "n" "o" "p" "s" "t" "u" "w"
# [18] "x" "y" "z"
#
# $summary_colours
#  [1] "#440154FF" "#481567FF" "#482677FF" "#453781FF" "#404788FF"
#  [6] "#39568CFF" "#33638DFF" "#2D708EFF" "#287D8EFF" "#238A8DFF"
# [11] "#1F968BFF" "#20A387FF" "#29AF7FFF" "#3CBB75FF" "#55C667FF"
# [16] "#73D055FF" "#95D840FF" "#B8DE29FF" "#DCE319FF" "#FDE725FF"
What’s the performance like?
10 million numeric values
library(microbenchmark)
library(ggplot2)
library(scales)
library(viridisLite)

n <- 1e7
df <- data.frame(x = rnorm(n = n))

m <- microbenchmark(
  colourvalues = { colourvalues::colour_values(x = df$x) },
  scales = { col_numeric(palette = rgb(subset(viridis.map, opt=="D")[, 1:3]), domain = range(df$x))(df$x) },
  times = 25
)
m
# Unit: seconds
#          expr      min       lq     mean   median       uq      max neval
#  colourvalues 1.590618 1.626491 1.669927 1.645881 1.700298 1.857823    25
#        scales 2.805023 2.942096 3.011355 3.000689 3.036244 3.537374    25

autoplot(m)
# Coordinate system already present. Adding new coordinate system, which will replace the existing one.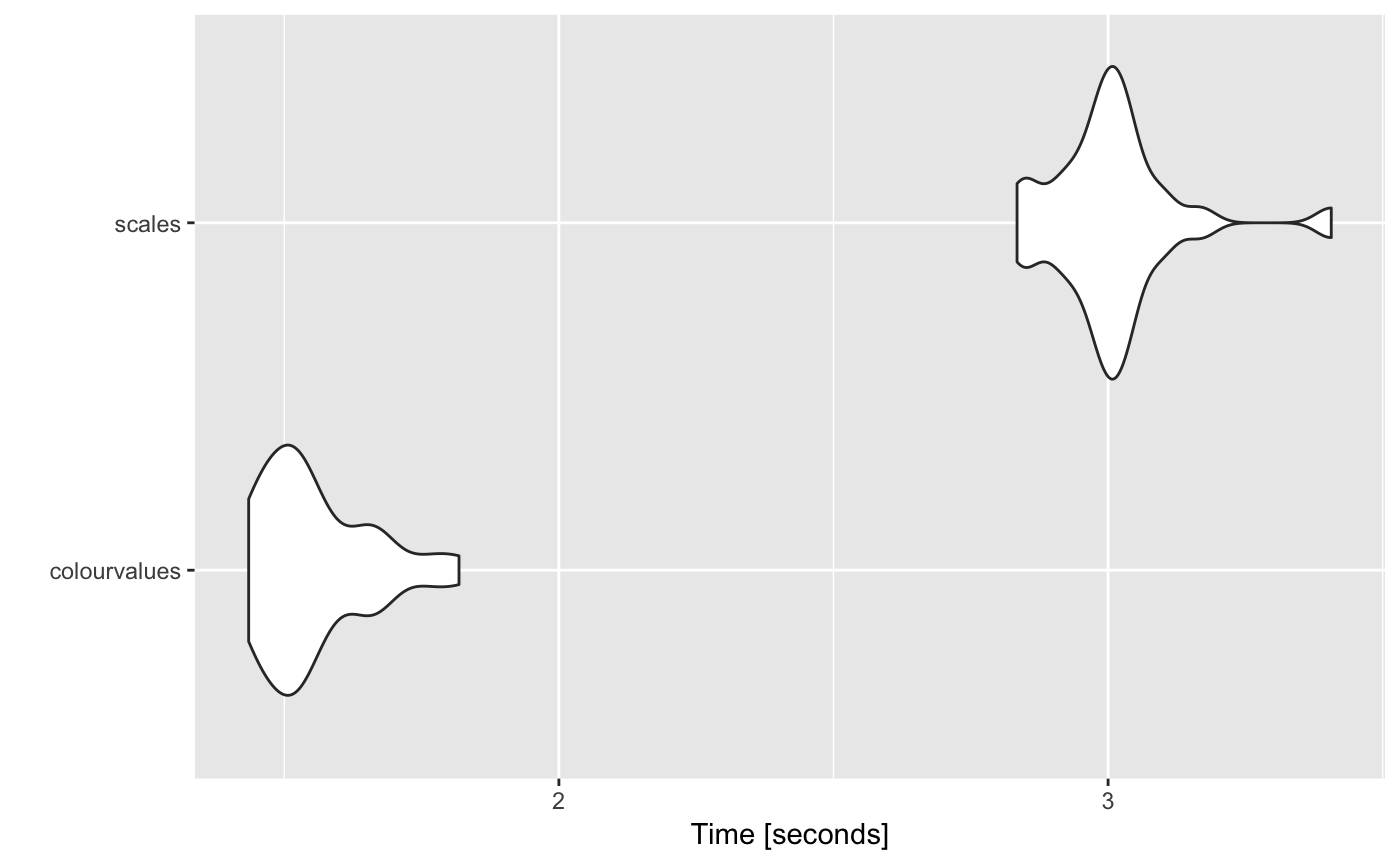
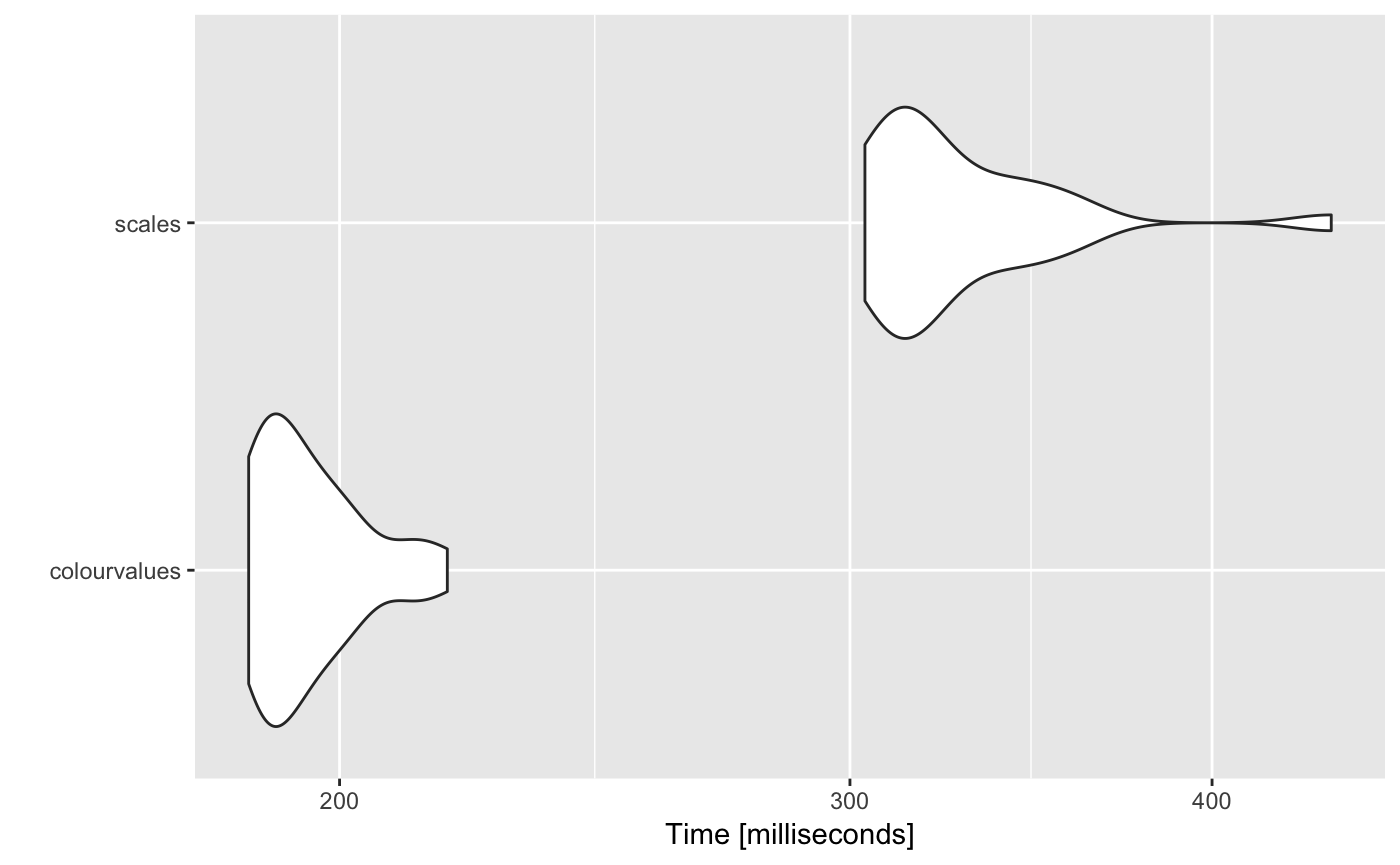
1 million characters (26 unique values)
library(microbenchmark)
library(ggplot2)
library(scales)
library(viridisLite)

n <- 1e6
x <- sample(x = letters, size = n, replace = TRUE)
df <- data.frame(x = x)

m <- microbenchmark(
  colourvalues = { x <- colourvalues::colour_values(x = df$x) },
  scales = { y <- col_factor(palette = rgb(subset(viridis.map, opt=="D")[, 1:3]), domain = unique(df$x))(df$x) },
  times = 25
)
m
# Unit: milliseconds
#          expr      min       lq     mean   median       uq      max neval
#  colourvalues 186.0676 188.7427 195.2648 192.8407 199.8790 217.8761    25
#        scales 303.5928 310.3133 327.8760 317.6924 338.1438 439.7298    25

autoplot(m)
# Coordinate system already present. Adding new coordinate system, which will replace the existing one.